GCSE results tomorrow: what a 9, a 5 and a 4 actually mean
GCSE results land on Thursday. If you last sat exams when grades were letters, here is what England's 9 to 1 numbers really mean, the two passes that confuse everyone, and why a 9 beats an old A*.
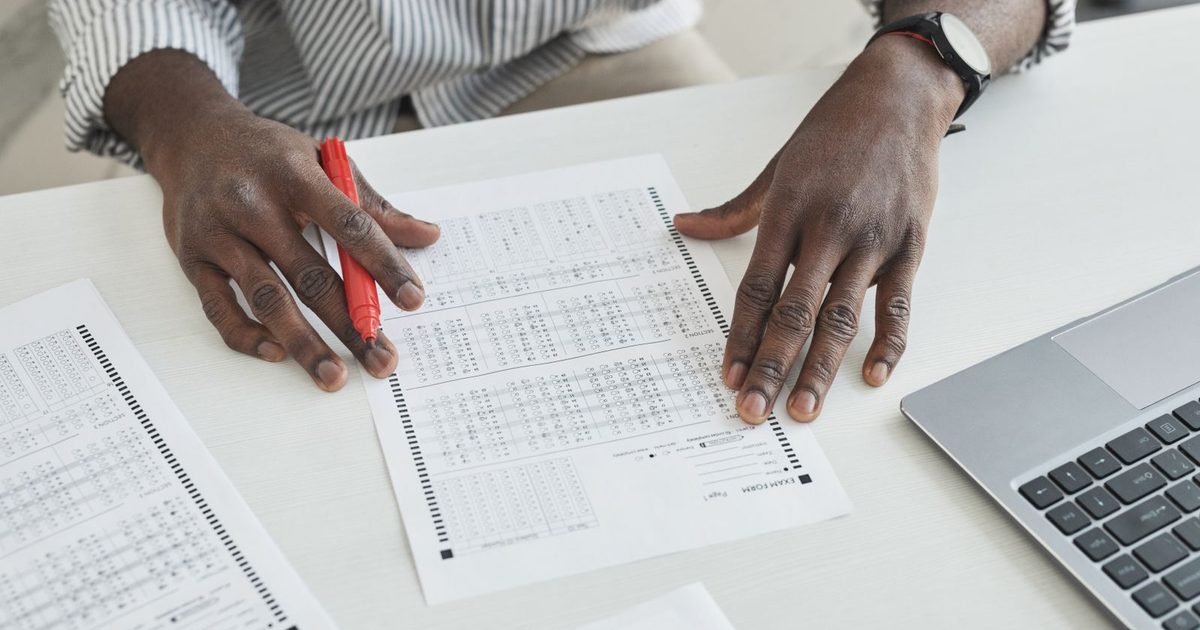
Hundreds of thousands of teenagers in England collect their GCSE results on Thursday 20 August, and a good many parents will squint at the sheet and wonder what the numbers mean. Since the reforms of the late 2010s, GCSEs in England have been graded from 9 down to 1 rather than A* to G. If you last sat exams when grades were letters, here is how to read the new scale.
The scale, top to bottom
Grade 9 is the highest and grade 1 the lowest, with U, for ungraded, below that. The numbers do not map neatly onto the old letters, because the reform added more steps at the top. As a rough guide, grades 9, 8 and 7 cover the old A* and A; grades 6, 5 and 4 cover the old B and C; and grades 3, 2 and 1 cover the old D down to G. Three official anchor points make it concrete: the bottom of grade 7 lines up with the bottom of the old A, the bottom of grade 4 with the bottom of the old C, and the bottom of grade 1 with the bottom of the old G.
The two passes that confuse everyone
There is no longer a single "pass". A grade 4 is a standard pass, pegged to the bottom of the old grade C, and it is the benchmark most colleges, apprenticeships and employers accept as meeting their minimum. A grade 5 is a strong pass, sitting around a high C or low B, and it is what more competitive sixth forms often ask for, particularly in English and maths. The practical line to know is that a student who does not reach grade 4 in English or maths is normally expected to keep resitting until they do.
Why a 9 is not just an old A*
The most misread grade is the 9. It is not simply the new name for an A*; it was created to stretch the very top and pick out the strongest candidates, so it is deliberately harder to earn. Around one in five of all grades at 7 or above is a 9. So a clutch of 9s is a bigger achievement than a row of A*s once was, and worth recognising as such.
The percentage that moves every year
One thing trips up parents and students alike: the mark needed for each grade is not fixed. Examiners set the grade boundaries after all the papers are marked, adjusting them so that standards stay comparable from one year and one cohort to the next. That means a 7 might need 68 per cent one summer and 71 per cent the next, and a raw mark tells you little until you know that year's boundary. If you want to turn marks into a percentage to compare papers or years, our percentage calculator does it in a keystroke, and it is the same reason we warned against reading too much into a headline figure in the A-level results percentage-point trap.
What actually matters on the day
For all the detail, the picture is simpler than it looks. A grade 4 or above in English and maths opens most of the doors that come next, a grade 5 opens a few more, and beyond that it is the overall profile of grades that counts rather than any single number. And a disappointing sheet is not the end of the road: results can be queried through a school, papers can be reviewed, and there are resits and other routes into almost everything. The numbers are new, but the old truth still holds, which is that one morning's grades matter far less in a year's time than they feel like they do on the day.
This is general information. The 9 to 1 scale applies to GCSEs in England; Wales and Northern Ireland still use A* to G. Grading details are from Ofqual. For results queries, resits or appeals, speak to your school or college.
Photo by Andy Barbour on Pexels.
More from Hopi News
All news › A-level results: the percentage-point trap in the headlines
Top grades edged up again this year, to 28.5 per cent of entries. Call that a rise of 0.2 per cent and you have made the classic results-day error. Here is what the numbers really say.
A-level results: the percentage-point trap in the headlines
Top grades edged up again this year, to 28.5 per cent of entries. Call that a rise of 0.2 per cent and you have made the classic results-day error. Here is what the numbers really say.
 Inflation is back up to 2.9%. Here is what it does to your money.
UK inflation rose to 2.9% in July, its first climb in months, pushed up by energy bills. It nudges above the Bank of England's target and quietly shrinks both pay and savings. Here is what the figures mean for you.
Inflation is back up to 2.9%. Here is what it does to your money.
UK inflation rose to 2.9% in July, its first climb in months, pushed up by energy bills. It nudges above the Bank of England's target and quietly shrinks both pay and savings. Here is what the figures mean for you.
 How much water do you actually need in hot weather?
The UK has just been through its fifth-hottest day on record. As the fiercest heat passes and hosepipe bans linger, here is how much water you really need, and the tired myths worth dropping.
How much water do you actually need in hot weather?
The UK has just been through its fifth-hottest day on record. As the fiercest heat passes and hosepipe bans linger, here is how much water you really need, and the tired myths worth dropping.
Use the tool: Percentage calculator.