The October energy price cap lands next week: what to expect
Ofgem confirms the October to December price cap next Tuesday, and forecasts point to a rise of about 4%. Here is what the cap actually controls, why it is not a cap on your bill, and how to work out your own.

Next Tuesday, 26 August, Ofgem will confirm the energy price cap for October to December, the level that shapes what most households in England, Scotland and Wales pay for gas and electricity through the autumn. The regulator resets it every three months, using wholesale and other costs measured over a fixed window, in this case from 19 May to 18 August. With that window now more than three-quarters closed, the forecasts have largely settled, and they point one way: up a little.
Cornwall Insight, the analyst whose predictions Ofgem-watchers follow most closely, put the October cap at £1,729 a year for a typical dual-fuel household paying by direct debit in its 19 August forecast. That is a rise of about £66, or roughly 4 per cent, on the current £1,663. It is a forecast rather than a fact until Ofgem publishes, but at this stage of the window the room for a surprise is narrow.
The thing almost everyone gets wrong about the cap
Here is the point that trips up most headlines. The price cap is not a cap on your bill. In Ofgem's own words, it is "the maximum amount your supplier can charge for a unit of energy and standing charge together", and "it does not limit the cost of your total bill". The widely quoted figure, £1,663 now and perhaps £1,729 from October, is simply what a household with typical usage would pay. Use more than that household and you pay more; use less and you pay less. There is no ceiling on the total.
What the cap actually sets is two things: the maximum unit rate, in pence per kilowatt hour, for your gas and electricity, and the maximum daily standing charge, the fixed fee you pay before you have used anything at all. When the cap rises, it is those two numbers that move.
What it means for you
Because the cap works per unit, the only real lever on your bill is how much energy you use. A 4 per cent rise in the unit rate lands hardest on the highest users and barely touches a household that has already cut back. If you want to translate the rate into real money, our energy running cost calculator shows what any appliance costs to run at your unit rate, from the kettle to the tumble dryer, which is the quickest way to see where your money actually goes.
It is also worth knowing that the cap is not the only option. Suppliers offer fixed deals that can sit above or below the capped rate, and if a fix is cheaper than the forecast winter cap it can be worth locking in; the cap simply protects you if you do nothing. One quirk in the current forecast is that it already takes in a government cut to VAT on electricity announced in July, without which the rise would have been steeper.
Why it is going up at all
The bulk of the cap, more than 40 per cent, is the wholesale cost of gas and electricity, and those prices have stayed firm through the summer. It is the same pressure that pushed inflation back up to 2.9 per cent in July, as we covered in inflation is back up to 2.9 per cent: energy is doing a lot of the work in the cost-of-living numbers right now. The confirmed cap on 26 August will set the terms for the winter, and it is worth a look at your own usage before it does.
This is general information, not financial advice. The current cap is from Ofgem; the October figure is a Cornwall Insight forecast published on 19 August 2026 and will be confirmed by Ofgem by 26 August. Cap figures are for a typical dual-fuel household paying by direct debit; your own bill depends on your usage, tariff and region.
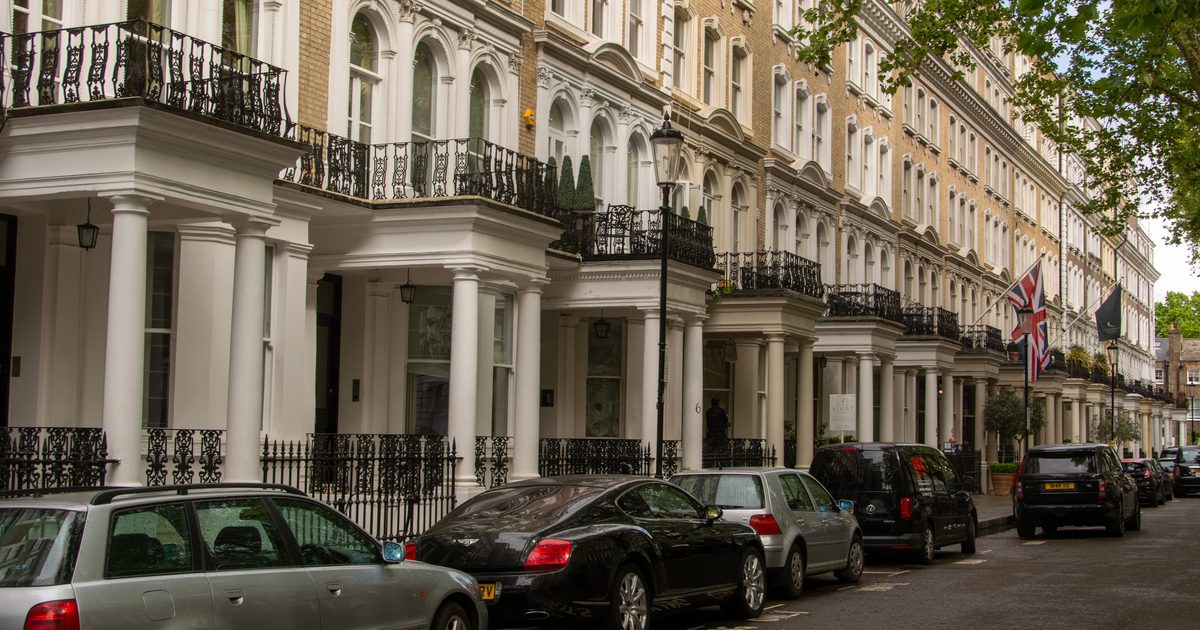
Photo by Sarah Chai on Pexels.
More from Hopi News
All news › Inflation is back up to 2.9%. Here is what it does to your money.
UK inflation rose to 2.9% in July, its first climb in months, pushed up by energy bills. It nudges above the Bank of England's target and quietly shrinks both pay and savings. Here is what the figures mean for you.
Inflation is back up to 2.9%. Here is what it does to your money.
UK inflation rose to 2.9% in July, its first climb in months, pushed up by energy bills. It nudges above the Bank of England's target and quietly shrinks both pay and savings. Here is what the figures mean for you.
 Your pay rose 3.5%. After inflation, almost none of it stuck.
A 3.5% pay rise sounds like a win. Once inflation and tax take their share, and with the job market quietly cooling, most of it disappears. Here is what today's figures say, and how to check your own.
Your pay rose 3.5%. After inflation, almost none of it stuck.
A 3.5% pay rise sounds like a win. Once inflation and tax take their share, and with the job market quietly cooling, most of it disappears. Here is what today's figures say, and how to check your own.
 Home repossessions are falling, and mostly on old mortgages
The latest UK Finance figures show mortgage arrears and repossessions falling for the first time since 2023. The detail behind the numbers is more reassuring than the headline, and it points to one useful move if money ever gets tight.
Home repossessions are falling, and mostly on old mortgages
The latest UK Finance figures show mortgage arrears and repossessions falling for the first time since 2023. The detail behind the numbers is more reassuring than the headline, and it points to one useful move if money ever gets tight.
Use the tool: Energy running cost calculator.